Compare Philadelphia, PA Car Insurance Rates [2024]
How much is car insurance in Philadelphia? The average cost of car insurance in Philadelphia, Pennsylvania is $623/mo or $7,482 annually. Experienced, older drivers with clean driving records receive cheap car insurance in Philadelphia. You can find the best insurance in Philadelphia by comparing rates from the best car insurance companies in PA. Compare quotes from multiple companies to find the cheap car insurance rates in Philadelphia, PA now.
Read moreFree Car Insurance Comparison
Compare Quotes From Top Companies and Save
Secured with SHA-256 Encryption
Dani Best
Licensed Insurance Producer
Dani Best has been a licensed insurance producer for nearly 10 years. Dani began her insurance career in a sales role with State Farm in 2014. During her time in sales, she graduated with her Bachelors in Psychology from Capella University and is currently earning her Masters in Marriage and Family Therapy. Since 2014, Dani has held and maintains licenses in Life, Disability, Property, and Casualt...
Licensed Insurance Producer
UPDATED: Jul 22, 2024
It’s all about you. We want to help you make the right coverage choices.
Advertiser Disclosure: We strive to help you make confident car insurance decisions. Comparison shopping should be easy. We are not affiliated with any one car insurance company and cannot guarantee quotes from any single company.
Our partnerships don’t influence our content. Our opinions are our own. To compare quotes from top car companies please enter your ZIP code above to use the free quote tool. The more quotes you compare, the more chances to save.
Editorial Guidelines: We are a free online resource for anyone interested in learning more about auto insurance. Our goal is to be an objective, third-party resource for everything auto insurance related. We update our site regularly, and all content is reviewed by auto insurance experts.
UPDATED: Jul 22, 2024
It’s all about you. We want to help you make the right coverage choices.
Advertiser Disclosure: We strive to help you make confident car insurance decisions. Comparison shopping should be easy. We are not affiliated with any one car insurance company and cannot guarantee quotes from any single company.
Our partnerships don’t influence our content. Our opinions are our own. To compare quotes from top car companies please enter your ZIP code above to use the free quote tool. The more quotes you compare, the more chances to save.
On This Page
- The average rate of car insurance in Philadelphia, Pennsylvania is $623 per month or $7,482 annually
- Drivers aged sixty receive the lowest average auto insurance rates in Philadelphia
- Your ZIP code, age, driving record, credit history, and more all impact your Philadelphia car insurance costs
How much is car insurance in Philadelphia? The average rate of car insurance in Philadelphia, Pennsylvania is $623 per month or $7,482 annually.
Whether you’ve come to this great city to discover the history, the cheesesteaks, or to feel the brotherly love, one thing is for sure, you should comparison shop for the best car insurance companies in PA.
Philadelphia is home to 1.58 million people and is our nation’s fifth-largest city. Often called the birthplace of America, Philadelphia is where our founding fathers wrote and signed our Declaration of Independence from Great Britain in 1776.
Like most states, Pennsylvania requires all drivers to purchase and compare liability car insurance coverage to legally drive in the state.
But with so many sites to see and things to do, we know the streets are filled with taxis, pedestrians, city buses, and all makes and models of vehicles.
With such a long, storied history, some neighborhoods feature old, narrow streets with cobblestones, which, in turn, can make driving hazardous. Accidents can and do happen, all of which can make your car insurance rates go up.
In this comprehensive guide, we’re going to show you real car insurance costs in Philadelphia, perform some Philadelphia car insurance company comparisons and deep dive into other specific factors that impact the average car insurance cost in Philadelphia.
Want to start comparison shopping today? Find the best insurance in Philadelphia by entering your five-digit Philly ZIP code into our FREE quote comparison tool above.
Car Insurance Rates in Philadelphia, PA
Why is car insurance so expensive in Philadelphia? Let’s look into that question.
The average car insurance in Philadelphia is $623 per month or $7,482 per year. We know, that’s a lot of cheesesteaks. No matter whether you get them from Pat’s or Geno’s, there are ways to save money on your car insurance.
Car insurance rates are based on many factors, including your age, marital status, and whether you live in Kensington or closer to Center City.
In this section, we’re going to show you specific rates on what folks pay for their car insurance in Philadelphia based on some of these factors. Of course, these rates are average, and your rates can be higher or lower, depending upon your circumstances.
For more information, see what are the factors that affect car insurance rates?
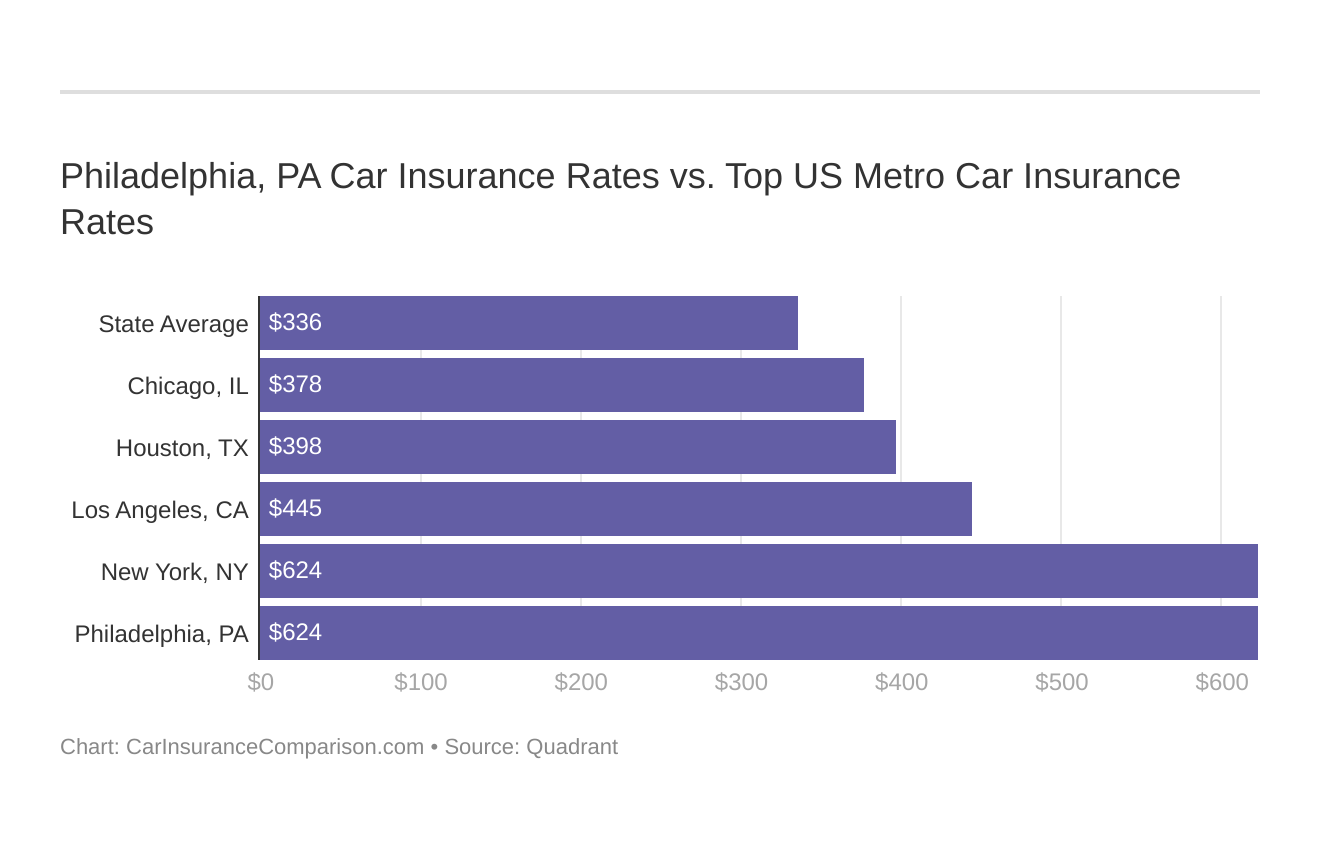
Philadelphia, PA Car Insurance Rates vs. Top US Metro Car Insurance Rates
You might find yourself asking how does my Philadelphia, PA stack up against other top metro auto insurance rates? We’ve got your answer below.
Do gender and age affect my car insurance rates in Philadelphia, PA?
Age plays a significant role when it comes to the cost of car insurance. Not only do people 55 or older get discounts on everything from food to hotels, but they also pay less for car insurance. For more information, see car insurance for seniors.
These states no longer using gender to calculate your auto insurance rates — Hawaii, Massachusetts, Michigan, Montana, North Carolina, and Pennsylvania. But age is still a significant factor because young drivers are often considered high-risk. For more information on rates and gender, see tips for finding car insurance for young drivers.
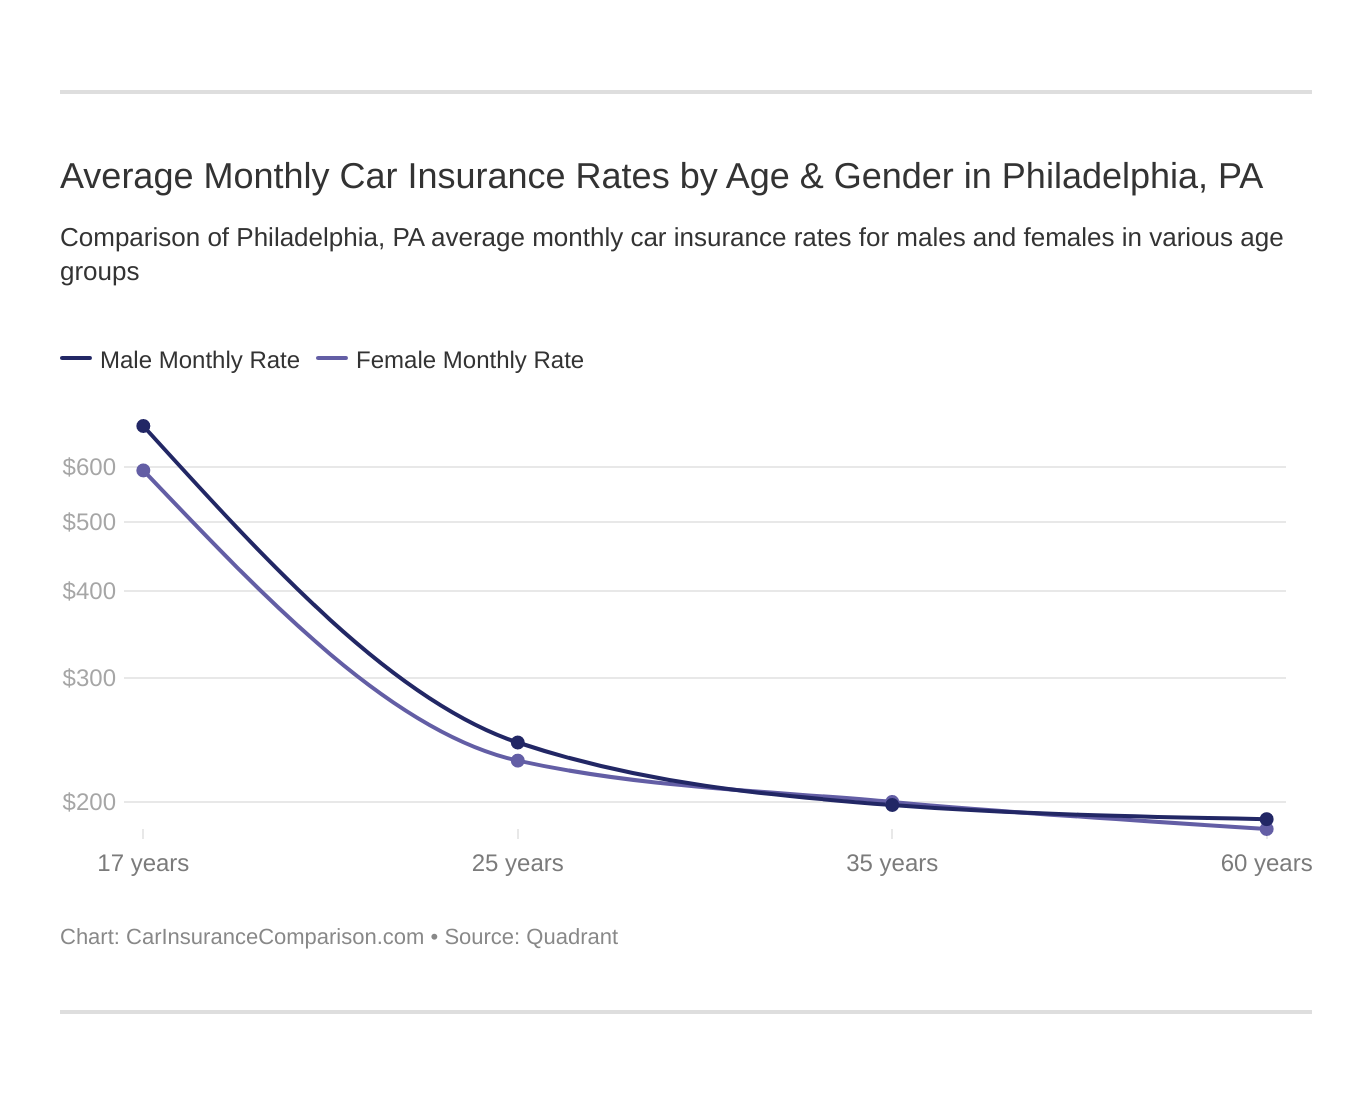
Pennsylvania does not use gender, so check out the average monthly auto insurance rates by age in Philadelphia, PA.
Not so for young drivers, especially male teen drivers who pay more for their car insurance than any other demographic.
The good news is that Pennsylvania does not allow insurers to consider gender when calculating rates. Excluding seven states, insurance rates differ by gender across the country.
Statistics show the mean age in Philadelphia is currently 34.4 years. Let’s review the average rates charged by insurance companies in Philadelphia for different age groups.
Philadelphia, PA Average Annual Car Insurance Rates by Age
| Diver Age | Average Annual Car Insurance Rates |
|---|---|
| 60-years-old | $3,856.53 |
| 35-years-old | $4,092.18 |
| 25-years-old | $4,779.13 |
| 17-years-old | $17,201.53 |
As the data shows, as drivers mature, their rates decrease over time by thousands of dollars.
Since we’re talking about the city of brotherly love, it’s not surprising that marital status plays a minor role in determining car insurance rates.
Considering popping the question? Make sure you let your insurance provider know they said yes, and see if it will impact the price you pay for your car insurance.
If you and your spouse combine your car insurance policies, you can save money by adding multiple vehicles onto a single policy. You can also bundle other insurance policies with your car insurance for even lower rates. For more information, see the difference between married car insurance vs. single car insurance.
As we mentioned previously, teen and young drivers pay thousands more than mature drivers. If you’re a young driver living in Philly, consider staying on your parents’ policy as a named driver. For more information, see how long can you stay on your parents’ car insurance?
If that is not an option, apply for good student discounts, like an honor roll car insurance discount, and safe driver discounts. For more information on safe driver discounts, see what is a safe driver discount?
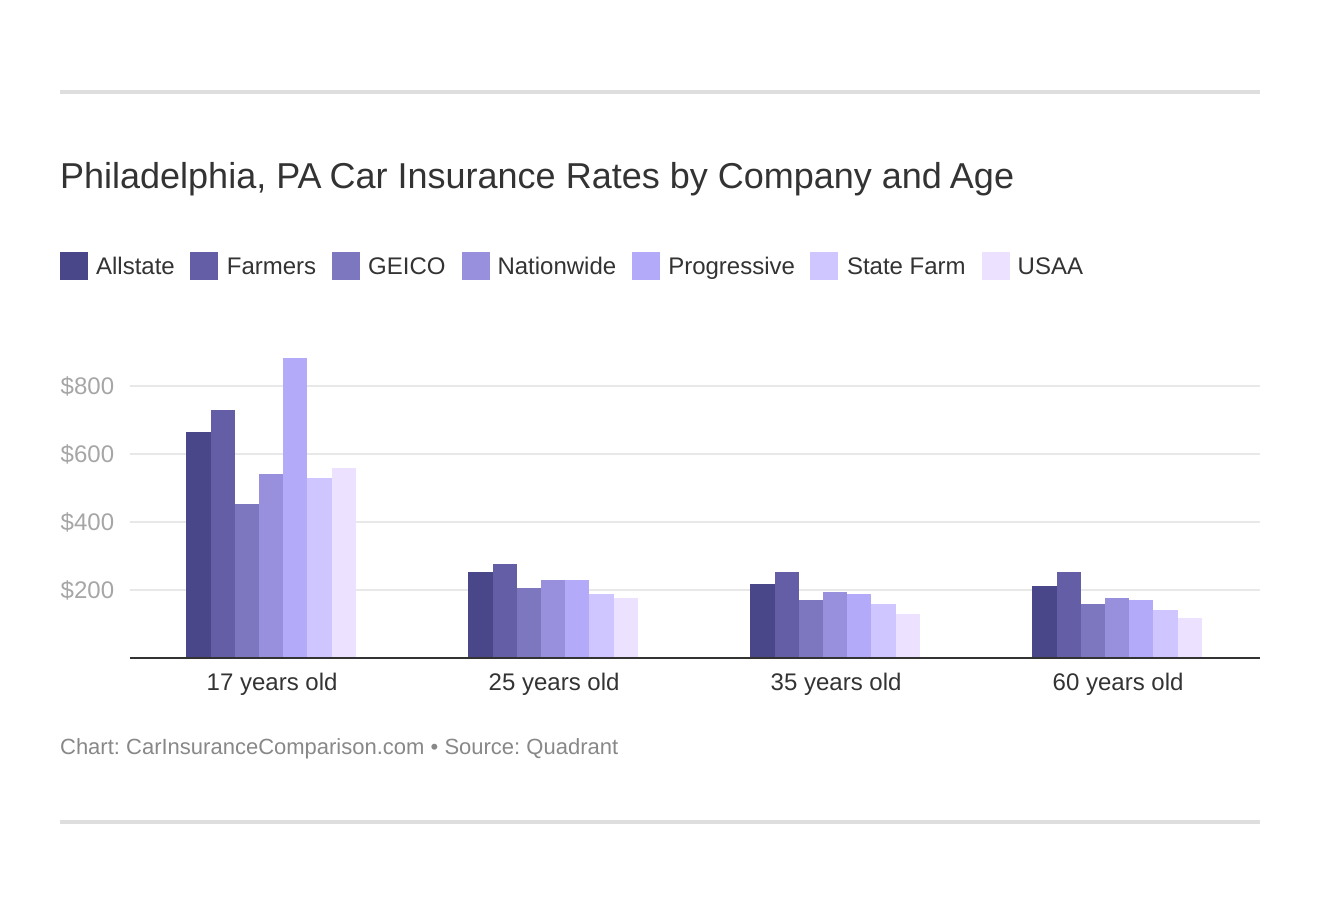
Philadelphia, PA auto insurance rates by company and age is an essential comparison because the top auto insurance company for one age group may not be the best company for another age group.
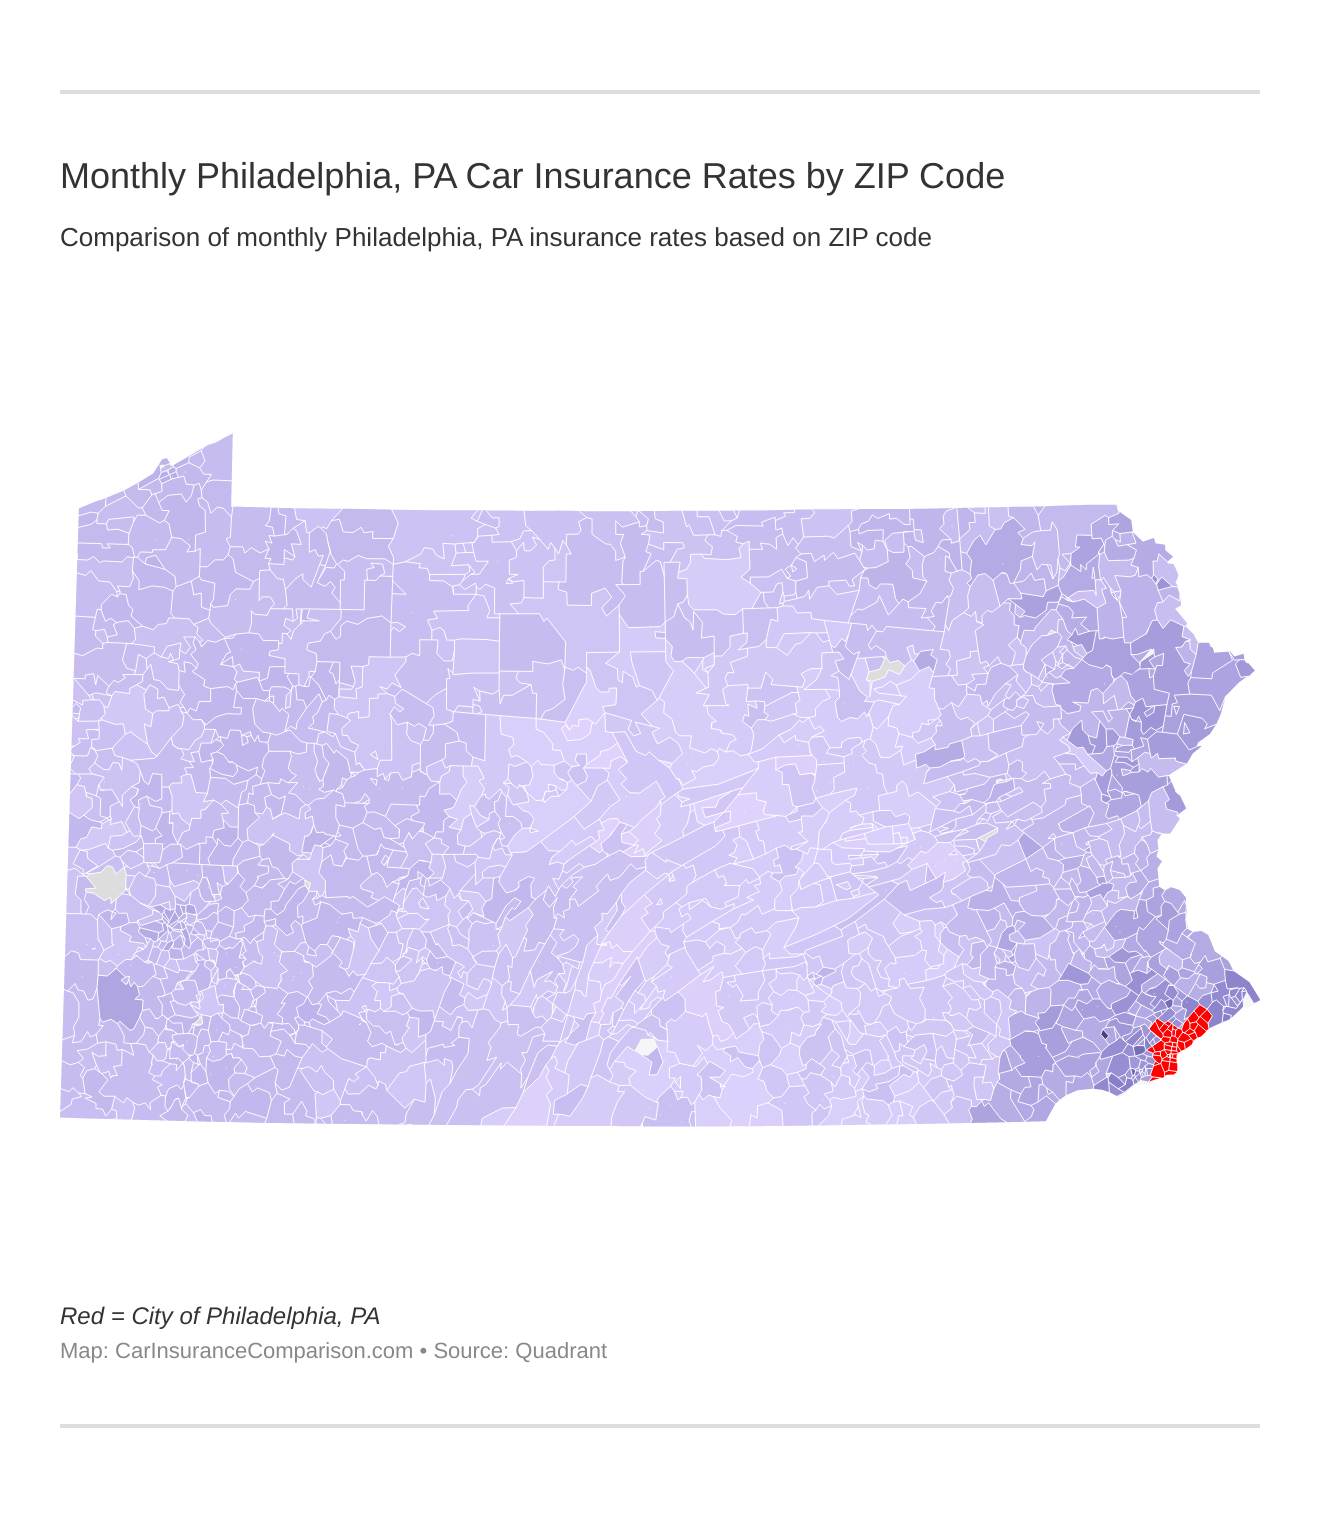
What ZIP codes have the cheapest car insurance rates in Philadelphia, PA?
Where you live in Philadelphia can also impact how much you pay for car insurance. Large metropolitan areas have certain areas plagued with poverty, crime, and decay. If you live in those neighborhoods, you can pay more for your car insurance.
Check out the monthly Philadelphia, PA auto insurance rates by ZIP Code below:
Check out the table below to see how much you pay for car insurance based upon where you reside.
Philadelphia, PA Average Annual Car Insurance Rates by ZIP Code
| Philadelphia, PA ZIP Codes | Average Annual Car Insurance Rates |
|---|---|
| 19113 | $7,230.41 |
| 19128 | $7,971.25 |
| 19118 | $8,015.18 |
| 19127 | $8,067.84 |
| 19154 | $8,305.29 |
| 19114 | $8,418.71 |
| 19129 | $8,567.87 |
| 19116 | $8,681.96 |
| 19119 | $8,717.53 |
| 19137 | $8,731.85 |
| 19152 | $8,761.68 |
| 19102 | $8,771.34 |
| 19136 | $8,797.21 |
| 19115 | $8,865.96 |
| 19111 | $8,957.91 |
| 19106 | $9,023.19 |
| 19149 | $9,043.03 |
| 19130 | $9,125.87 |
| 19103 | $9,148.09 |
| 19150 | $9,169.50 |
| 19151 | $9,178.22 |
| 19135 | $9,194.67 |
| 19107 | $9,241.41 |
| 19110 | $9,248.59 |
| 19123 | $9,298.94 |
| 19146 | $9,337.55 |
| 19144 | $9,362.74 |
| 19109 | $9,392.81 |
| 19147 | $9,428.07 |
| 19148 | $9,508.89 |
| 19131 | $9,539.80 |
| 19190 | $9,564.29 |
| 19104 | $9,581.50 |
| 19138 | $9,631.63 |
| 19134 | $9,650.55 |
| 19124 | $9,672.32 |
| 19126 | $9,681.59 |
| 19153 | $9,685.55 |
| 19125 | $9,719.20 |
| 19145 | $9,771.21 |
| 19120 | $9,780.21 |
| 19141 | $9,793.33 |
| 19112 | $10,086.22 |
| 19122 | $10,186.97 |
| 19143 | $10,219.59 |
| 19121 | $10,283.48 |
| 19139 | $10,358.57 |
| 19140 | $10,370.26 |
| 19142 | $10,372.77 |
| 19132 | $10,446.90 |
| 19133 | $10,480.35 |
If your ZIP code is 19113, you’re getting some of the best car insurance quotes in Philadelphia. Unfortunately, residents in the Fairhill neighborhood pay the most for their car insurance with yearly rates of over $10,400 per year.
Which companies have the best car insurance rates in Philadelphia, PA?
Who is the best car insurance company in Philadelphia? The word best can mean different things to different people.
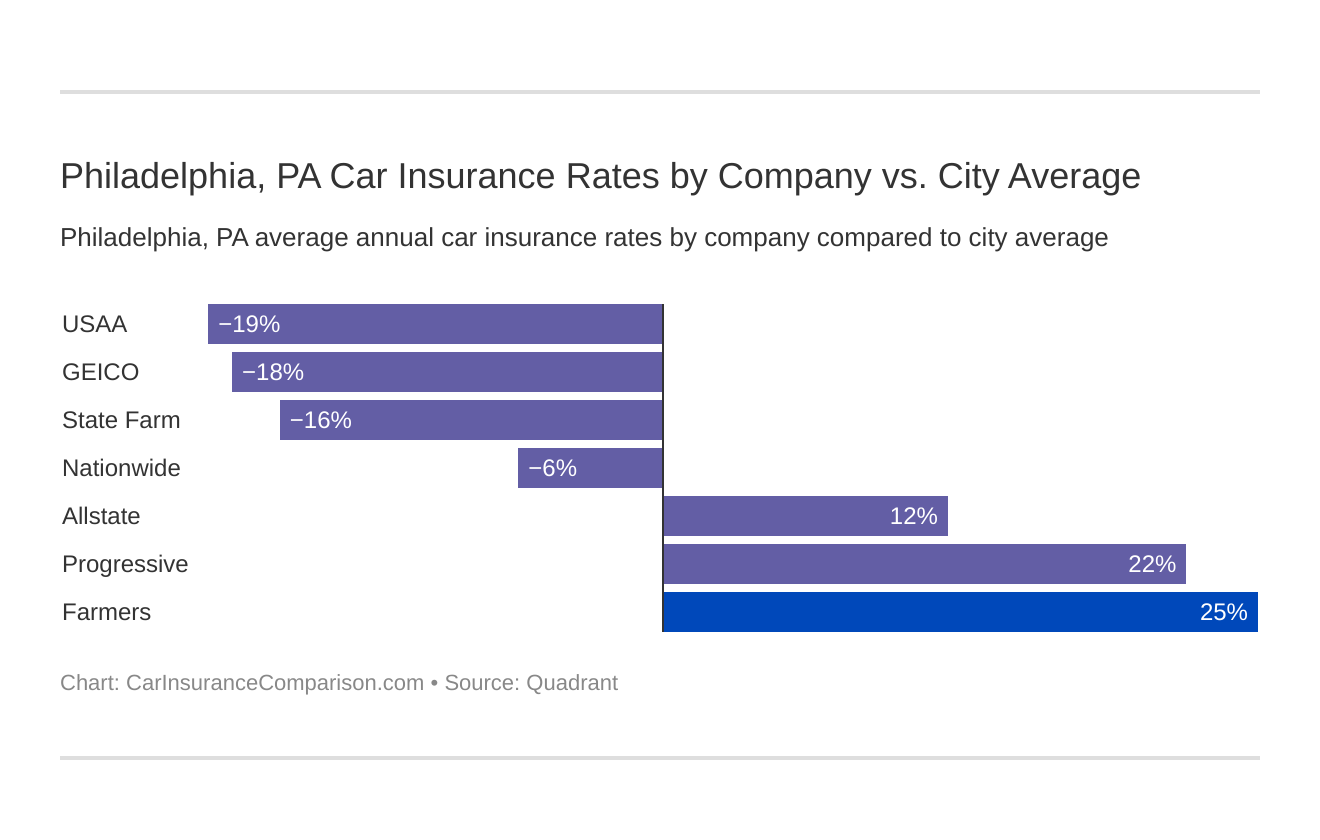
Which Philadelphia, PA auto insurance company has the cheapest rates? And how do those rates compare against the average Pennsylvania auto insurance company rates? We’ve got the answers below.
In the sections below, we’ll explain what’s considered best, in various categories, to see if it can help you save on your car insurance.
Cheapest Car Insurance Rates by Company in Philadelphia, PA
We’re all looking for the cheapest car insurance. But, at the end of the day, we really want the best cheap car insurance. Insurance quality matters. All of the top providers are licensed in Philadelphia.
Check out the table below, which compares average annual rates from car insurance companies in Philadelphia, PA.
Philadelphia, PA Average Annual Car Insurance Rates by Company
| Companies | Average Annual Rates for a Married 60-Year-Old Female | Average Annual Rates for a Married 60-Year-Old Male | Average Annual Rates for a Married 35-Year-Old Female | Average Annual Rates for a Married 35-Year-Old Male | Average Annual Rates for a Single 25-Year-Old Female | Average Annual Rates for a Single 25-Year-Old Male | Average Annual Rates for a Single 17-Year-Old Female | Average Annual Rates for a Single 17-Year-Old Male |
|---|---|---|---|---|---|---|---|---|
| USAA | $1,696.36 | $1,696.36 | $1,873.20 | $1,873.20 | $2,509.52 | $2,509.52 | $5,737.15 | $5,737.15 |
| State Farm | $2,671.30 | $2,671.30 | $2,999.54 | $2,999.54 | $3,322.46 | $3,322.46 | $10,223.02 | $10,223.02 |
| Nationwide | $3,321.34 | $3,321.34 | $3,487.69 | $3,487.69 | $3,880.78 | $3,880.78 | $9,294.93 | $9,294.93 |
| Travelers | $3,553.91 | $3,553.91 | $3,270.16 | $3,270.16 | $3,915.43 | $3,915.43 | $49,765.94 | $49,765.94 |
| Geico | $3,597.48 | $3,100.88 | $3,659.99 | $3,154.47 | $3,584.35 | $3,089.58 | $8,992.37 | $7,789.85 |
| Allstate | $4,251.22 | $4,251.22 | $4,534.62 | $4,534.62 | $4,920.02 | $4,920.02 | $15,830.38 | $15,830.38 |
| Progressive | $4,389.55 | $4,389.55 | $4,869.14 | $4,869.14 | $5,880.20 | $5,880.20 | $14,597.00 | $14,597.00 |
| Liberty Mutual | $7,619.34 | $7,619.34 | $8,295.78 | $8,295.78 | $10,467.69 | $10,467.69 | $23,772.74 | $23,772.74 |
The Philadelphia car insurance company that provides the lowest average rates across the board is USAA. However, only active or retired military personnel and their families are eligible to use services from that company. State Farm and Travelers are close behind. For more information, see USAA car insurance review.
As we mentioned previously, age has its benefits, and you can see why in the chart: men and women aged 60 enjoy the lowest rates on car insurance.
Conversely, single teen drivers pay thousands more than those with the same driving record. Be sure and talk to your insurance provider, especially if you are paying more for your car insurance than the rates listed here.
Best Car Insurance for Commute Rates in Philadelphia, PA
In Pennsylvania, according to the Federal Highway Administration, drivers average more than 11,203 miles driven each year. How far do you commute? And how does mileage affect my car insurance?
We teamed up with Quadrant Data Solutions to understand the impact of an above-average commute on your insurance. Check out the chart below to see how your commute stacks up against what others pay.
Philadelphia, PA Average Annual Car Insurance Rates by Commute Length
| Companies | Average Annual Rates for 10 Miles Commute 6,000 Annual Mileage | Average Annual Rates for 25 Miles Commute 12,000 Annual Mileage |
|---|---|---|
| USAA | $2,867.82 | $3,040.30 |
| Geico | $4,547.62 | $4,694.62 |
| State Farm | $4,648.40 | $4,959.76 |
| Nationwide | $4,996.18 | $4,996.18 |
| Allstate | $7,221.19 | $7,546.93 |
| Progressive | $7,433.97 | $7,433.97 |
| Liberty Mutual | $12,223.66 | $12,854.12 |
| Travelers | $15,126.36 | $15,126.36 |
Less than $500 separate top providers Nationwide, Geico, and State Farm when it comes to a short commute. However, Nationwide, Progressive, and Travelers insurance remain the same for short or long commutes.
Best Car Insurance for Coverage Level Rates in Philadelphia, PA
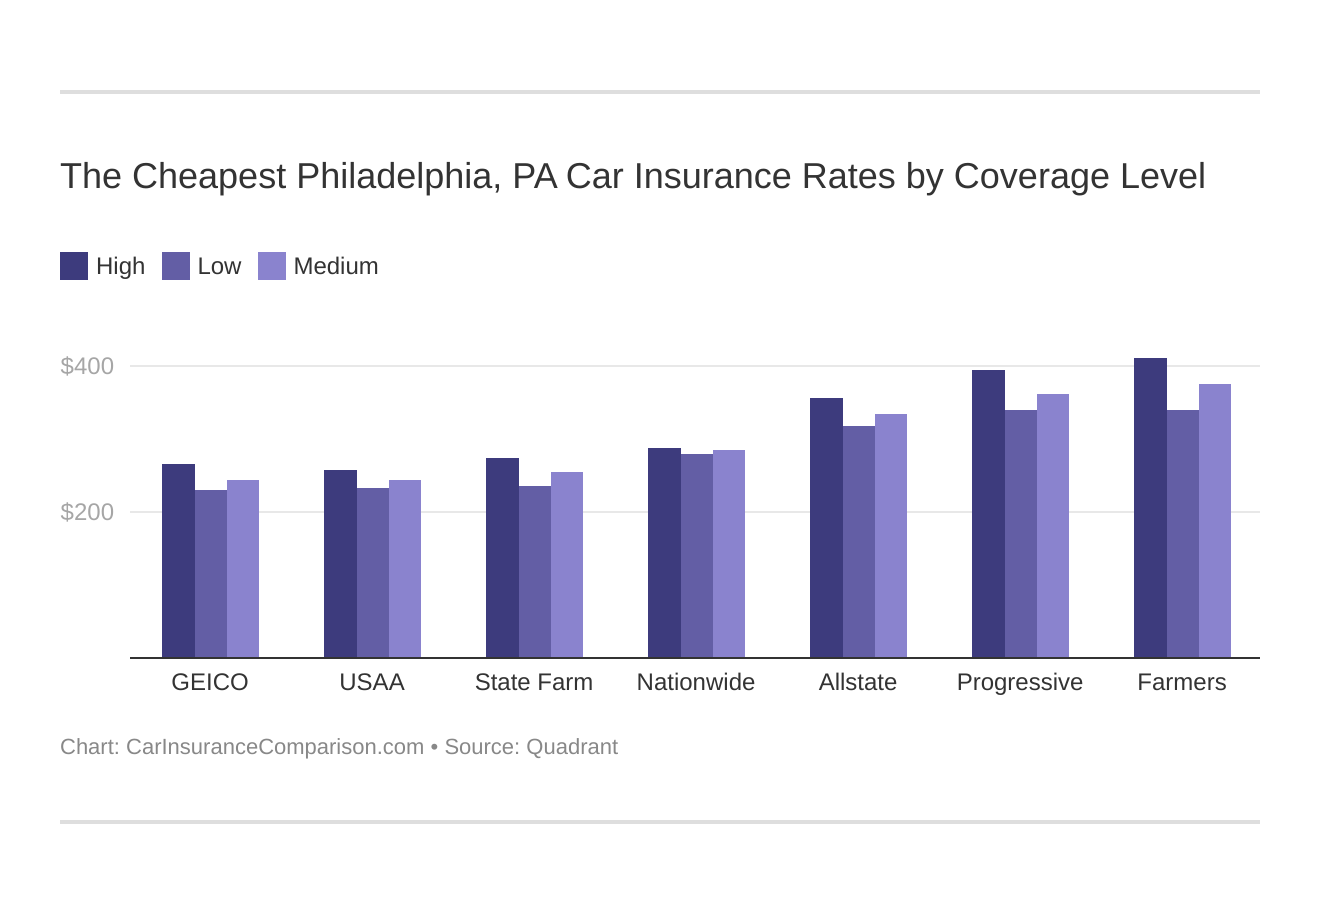
You might think that having the lowest minimum coverage in Philadelphia is the best way to ensure you and your family are protected. But that’s not necessarily the case, because sometimes the difference in low to high coverage is less than you think.
Your coverage level will play a major role in your Philadelphia auto insurance rates. Find the cheapest Philadelphia, PA auto insurance rates by coverage level below:
Check out the table below to see the differences in coverage.
Philadelphia, PA Average Annual Car Insurance Rates by Coverage Level
| Companies | Average Annual Rates with Low Coverage | Average Annual Rates with Medium Coverage | Average Annual Rates with High Coverage |
|---|---|---|---|
| USAA | $2,686.69 | $2,987.59 | $3,187.90 |
| Geico | $3,945.98 | $4,670.50 | $5,246.88 |
| State Farm | $4,417.09 | $4,881.11 | $5,114.04 |
| Nationwide | $4,876.19 | $5,060.43 | $5,051.93 |
| Allstate | $6,663.27 | $7,468.23 | $8,020.68 |
| Progressive | $6,400.45 | $7,453.60 | $8,447.87 |
| Liberty Mutual | $11,792.43 | $12,648.26 | $13,175.96 |
| Travelers | $14,699.01 | $15,177.09 | $15,502.99 |
If you’re a customer with Nationwide, it’s good news because there’s only a $150 difference between low and high coverage.
However, the news isn’t so good if you’re a Progressive customer because their rates are more than $2,000 higher between low to high coverage.
You might ask, what is high or low coverage?
Low coverage is the state-mandated minimum coverage required to drive legally in Pennsylvania.
The minimum car insurance coverage required in Pennsylvania is:
- Bodily Injury Liability – $15,000 for one person and $30,000 per accident
- Property Damage Liability – $5,000 per accident
- Medical Benefits – $5,000 medical coverage for you and others covered by your policy
However, you should consider adding important coverages for increased protection.
For high coverage, you can consider increasing your liability limits and opting for collision, comprehensive, MedPay, uninsured or underinsured motorist coverage, and personal injury protection (PIP) coverage.
Find out more: What is uninsured or underinsured motorist coverage? or what is personal injury protection (PIP) coverage?
Best Car Insurance for Credit History Rates in Philadelphia, PA
You’ve seen all of the commercials to check your score, but have you ever wondered why?
Besides not being able to secure a car loan or a mortgage, poor credit can also have an impact on how much you pay for car insurance.
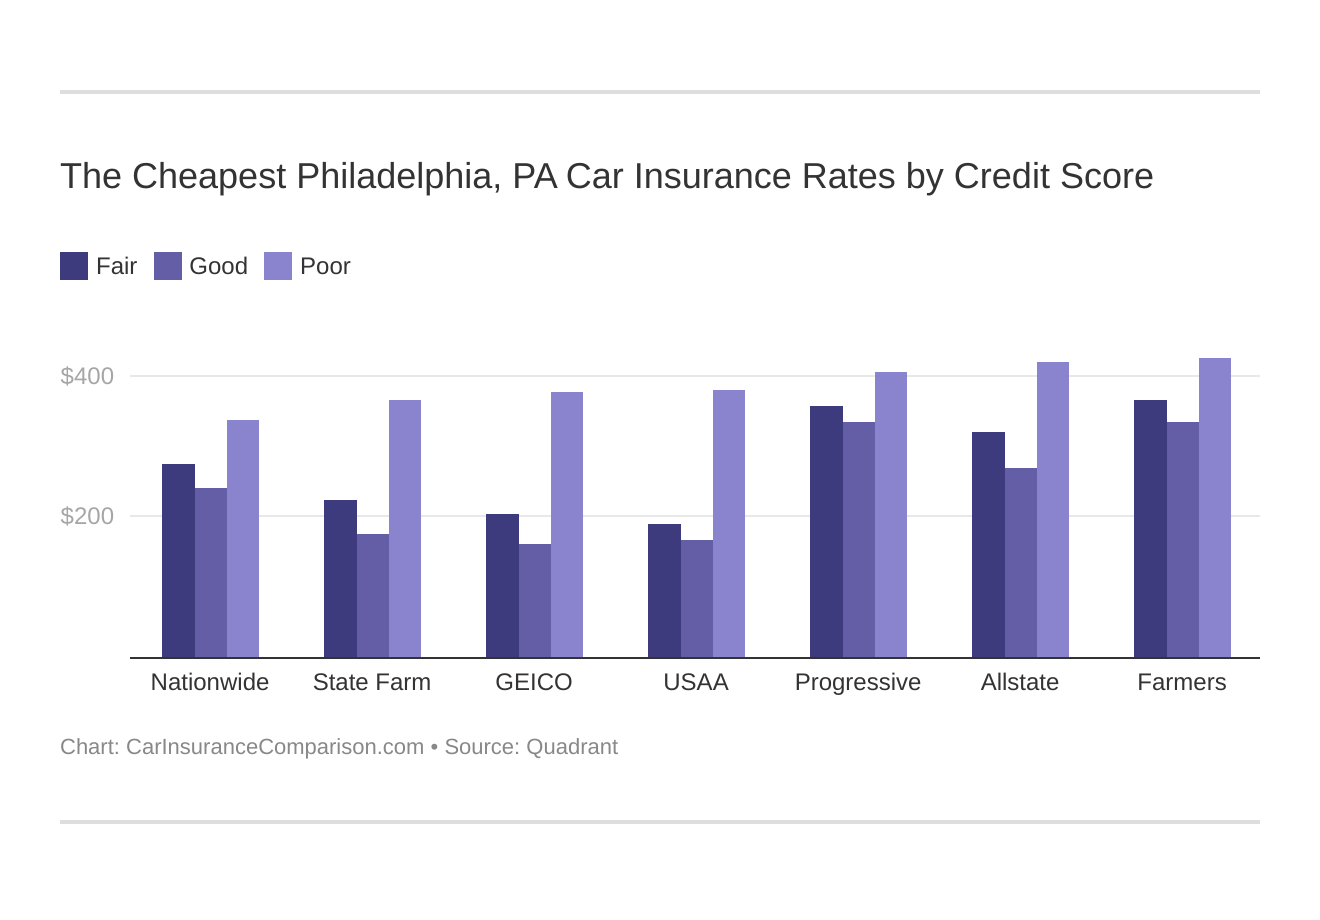
The table below reflects what you’ll pay for car insurance if you have good, fair, or poor credit. Of course, these are estimates, and your rates may be different based on your situation.
Philadelphia, PA Average Annual Car Insurance Rates by Credit History
| Companies | Average Annual Rates with Good Credit | Average Annual Annual Rates with Fair Credit | Average Annual Rates with Poor Credit |
|---|---|---|---|
| USAA | $2,393.33 | $2,724.60 | $3,744.26 |
| Geico | $2,986.78 | $3,893.08 | $6,983.51 |
| State Farm | $3,356.18 | $4,239.43 | $6,816.64 |
| Nationwide | $4,279.62 | $4,814.49 | $5,894.45 |
| Allstate | $5,638.55 | $7,048.60 | $9,465.03 |
| Progressive | $5,513.16 | $6,909.76 | $9,879.00 |
| Liberty Mutual | $10,176.47 | $11,494.99 | $15,945.20 |
| Travelers | $13,999.55 | $14,869.14 | $16,510.40 |
Your credit score will play a major role in your Philadelphia auto insurance rates unless you live in these states where discrimination based on credit is not allowed: California, Hawaii, and Massachusetts. Find the cheapest Philadelphia, PA auto insurance rates by credit score below.
The average credit score in the U.S. is 675. If your credit score is lower than this, you may face increased rates on car insurance. It would be wide for you to compare rates from companies that do not consider your credit score when calculating your premiums.
What car insurance companies don’t use credit ratings? Usually, Geico car insurance and The General will not use your credit score when determining car insurance rates. However, there might be local companies available to you as well.
In some states, poor credit can raise your rates by thousands of dollars. If your insurance provider is Liberty Mutual and you have poor credit, your rates can be $5,400 more than someone with good credit.
Customers with Nationwide can expect to save $2,600 based on their credit score.
Best Car Insurance for Driving Record Rates in Philadelphia, PA
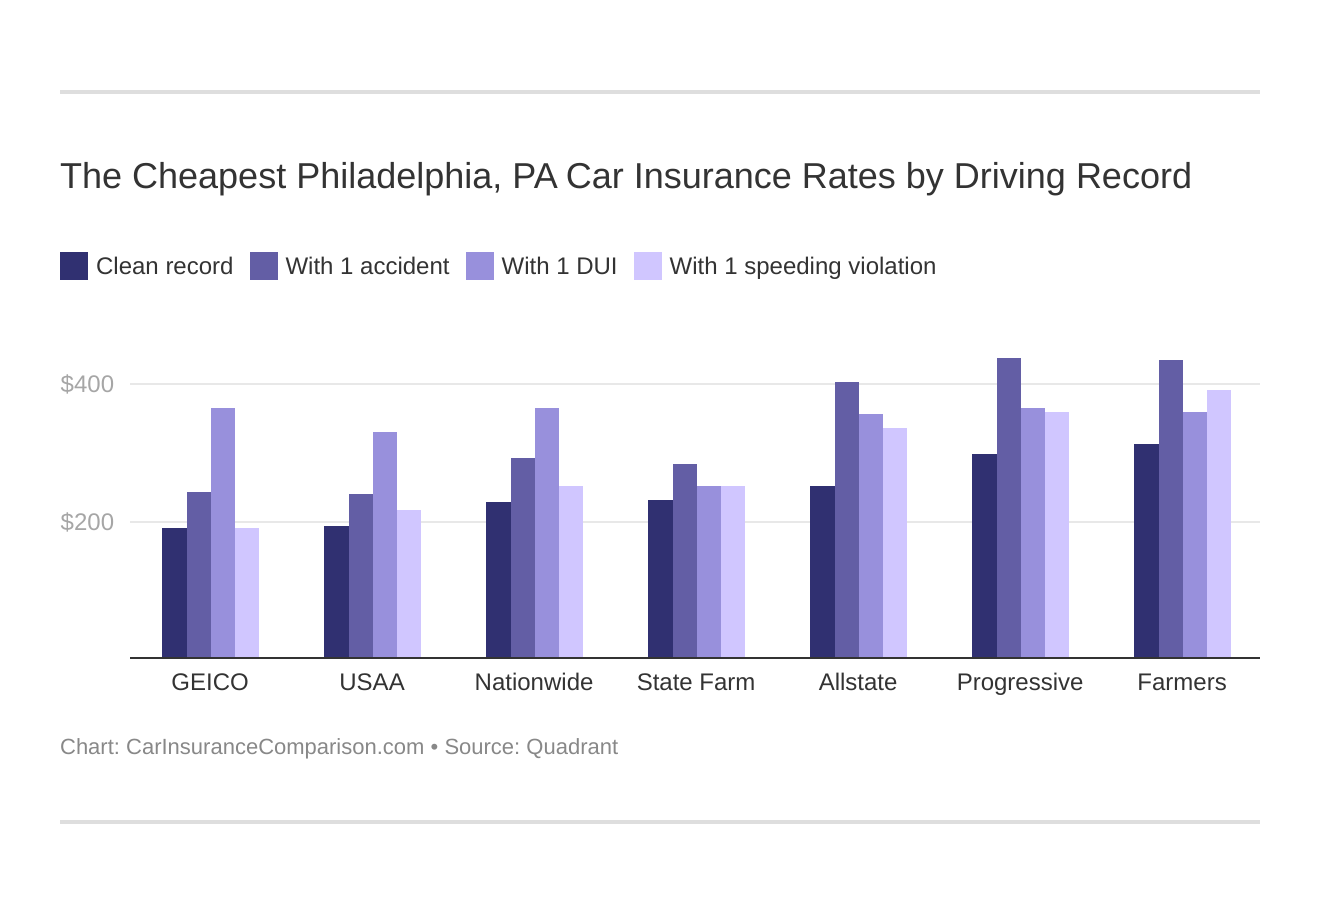
If you get a speeding ticket, have an accident, or get a DUI, your rates will probably increase in most situations. Any of these violations will categorize a driver as high-risk, so it’s worth learning about high-risk car insurance.
Your driving record will play a major role in your Philadelphia auto insurance rates. For example, other factors aside, a Philadelphia, PA DUI may increase your auto insurance rates 40% to 50%. See what are the DUI insurance laws in Pennsylvania to understand all the ins and outs.
Find the cheapest Philly auto insurance rates by driving record.
The table below shows rates with these three violations compared to the rate for a clean record.
Philadelphia, PA Average Annual Car Insurance Rates by Driving Record
| Companies | Average Annual Rates with a Clean Record | Average Annual Rates with One Speeding Violation | Average Annual Rates with One Accident | Average Annual Rates with One DUI |
|---|---|---|---|---|
| USAA | $2,362.27 | $2,646.58 | $3,288.44 | $3,518.96 |
| Geico | $3,356.70 | $4,667.79 | $5,913.58 | $4,546.42 |
| Nationwide | $3,654.90 | $4,822.52 | $4,841.23 | $6,666.09 |
| State Farm | $4,373.72 | $4,804.08 | $5,234.44 | $4,804.08 |
| Progressive | $6,727.17 | $6,778.57 | $9,240.42 | $6,989.74 |
| Allstate | $7,045.78 | $7,045.78 | $8,398.88 | $7,045.78 |
| Travelers | $10,688.46 | $15,238.90 | $15,238.90 | $19,339.18 |
| Liberty Mutual | $11,444.01 | $12,800.78 | $13,109.97 | $12,800.78 |
Having one too many can not only land you in jail, but it can cost you thousands on your car insurance. For example, a DUI will increase your rates by $8,500 if you have car insurance through Travelers.
Do all car insurance companies check driving records? Yes, all of them will look at this information to determine how risky of a driver you are. Your rates will vary, and we encourage you to always practice safe driving techniques and employ the best defensive driving tips.
Free Car Insurance Comparison
Enter your ZIP code below to view companies that have cheap car insurance rates.
Secured with SHA-256 Encryption
Car Insurance Factors in Philadelphia, PA
Car insurance rates are not based solely on driver-specific factors which we’ve mentioned above. Rates are also calculated on city-specific factors such as your zip code, economic prosperity in your city, and average income levels.
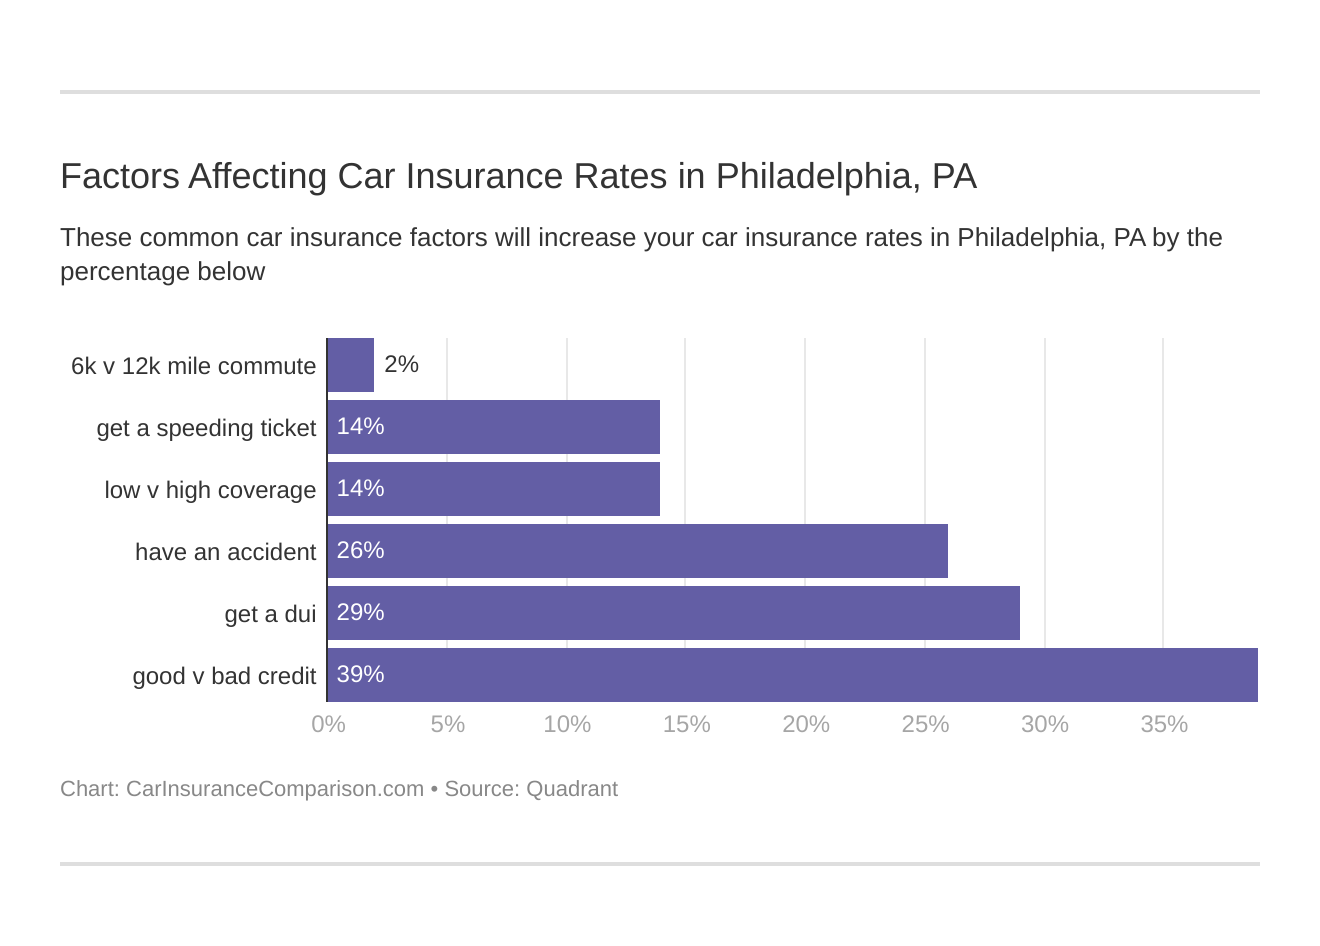
Factors affecting auto insurance rates in Philadelphia, PA may include your commute, coverage level, tickets, DUIs, and credit. Controlling these factors will help you maintain cheap Philadelphia, Pennsylvania auto insurance.
In this section, we’ll discuss how these external factors influence your car insurance rates in Philadelphia.
Philadelphia, PA Metro Report
According to Brookings, the Philadelphia metro area is the fifth-largest commercial center in the country.
Take a look at some details from the Gross Metropolitan report below.
- Growth: 38th out of 100
- Jobs: +1.4 percent, 51st of 100
- Gross metropolitan product (GMP): +2.4 percent. 44th of 100
- Jobs at young firms: +7.1 percent, 18th of 100
Although the city has experienced steady growth in the number of jobs, it lags behind the national average. The average annual wage also has remained constant over the assessment period.
- Prosperity: 44th out of 100
- Productivity: +1 percent. 47th of 100
- Standard of living: +2.1 percent, 24th of 100
- Average annual wage: +0.6 percent, 70th of 100
The Gross Metropolitan Product of the Philadelphia metro area in 2017 was $444 billion. The city is 38th in growth and 44th in prosperity out of the largest 100 metro areas in the country.
The metro area of Philly has registered steady job growth over the past few years.
Philadelphia, PA Median Household Income
According to DataUSA, the median household income of Philadelphia is only $39,759, whereas the national median household income is $60,336.
If you consider the Philadelphia metro area, the median household income increases to $68,652.
The average annual premium in Philadelphia is $9,302, which means that an average resident spends 23% of their annual income on car insurance. Moreover, if you consider the metro area, the residents pay around 13% of yearly income.
Homeownership in Philadelphia, PA
Owning your own home is a dream many of us have and may impact what rates you pay for insurance. Homeownership indicates the general health of the local economies and insurers usually consider it to be a good indicator of your financial stability.
Being a homeowner won’t directly impact your car insurance rates or your ability to qualify for a plan. But there may be additional discounts you are eligible for so be sure and check with your provider. Many providers allow bundling policies for car and home insurance and it often comes with some savings.
In Philadelphia, the average property value is $166,200, whereas the national average is $193,500. While property in the city is cheaper than the national average, property in the metro area ($240,700) is slightly more expensive, than the national average.
Education in Philadelphia, PA
According to City-Data, there are more than 80 degree-granting colleges and universities in the city of Philadelphia, making it the highest in the nation for higher education options.
The region around Philadelphia is also home to six medical schools, which, in turn, produce 20% of the country’s doctors.
According to the number of degrees conferred, the top three universities in Philadelphia are:
- The University of Pennsylvania (9,053 degrees awarded)
- Temple University (9,017 degrees awarded)
- Drexel University (7,549 degrees awarded)
If a four-year degree isn’t something you’re searching for, there are 12 community colleges within 40 miles of Philadelphia which offer two-year degrees as well as technical certificates and diplomas in many different fields.
Wage by Gender in Common Jobs in Philadelphia, PA
For every dollar a man earns, a woman earns just 79 cents. Although the wage gap is closing among male and female workers, there is still room for improvement.
In Philadelphia, insurers cannot offer varying insurance rates based on gender. However, due to the wage gap, females have to shell out a more significant percentage of their income towards car insurance.
According to DataUSA, the average male salary in Philadelphia is $68,603, while the average female wage is only $51,375.
Based on the wages mentioned above, we can calculate the percentage of income that you would have to shell to maintain car insurance in Philadelphia.
Philadelphia, PA Average Annual Car Insurance Rates as a Percent of Income by Gender
| Occupations | Car Insurance Rates as a Percent of Income: Male | Car Insurance Rates as a Percent of Income: Female |
|---|---|---|
| Miscellaneous managers | 8.5% | 11.4% |
| Registered nurses | 11.6% | 13.8% |
| Elementary & middle school teachers | 14.1% | 16.1% |
Professional females have to shell out a higher percentage of their income no matter which profession they’re in, which can affect their ability to pay high car insurance rates.
Poverty by Age and Gender in Philadelphia, PA
In Philadelphia, 25.8% of the city’s population lives below the poverty line, whereas the national average is 13.4%.
Females, aged 18-34 are the largest demographic living below the poverty line, while males in the same age group face similar challenges.
Poverty by Race and Ethnicity in Philadelphia, PA
Another eye-opening statistic of poverty in Philadelphia is that 41% of people living below the poverty line are black. That is about equal to the combined number of white and Hispanic people living below the poverty line.
Employment by Occupations in Philadelphia, PA
Philadelphia employs more than 670,000 people across different industries. The largest employers in the city are education, healthcare, and retail.
Driving in Philadelphia, PA
We’ve mentioned that your driving record, credit score, education level, and other factors contribute to what you pay for car insurance.
But insurance companies also base rates on the car your drive, traffic congestion in your area, road conditions, crime report, and so much more.
Road Conditions in Philadelphia, PA
With a city as large as Philadelphia, there are bound to be certain roads that are confusing and disorienting if you’re new to the city. Your GPS wants you to turn left, but somehow, you’ve managed to turn into a dead-end street, and your device goes into recalculating mode.
In this section, we’ll cover the highways and interstates and help you calculate which way you need to go so you’ll never make another wrong turn.
Major Highways in Philadelphia, PA
Philadelphia is mid-way between New York and Washington D.C. which makes it easy to travel anywhere on the east coast. The city is connected through I-95, I-76, Pennsylvania turnpike, and New Jersey Turnpike.
Unless you’ve lived in Philadelphia your entire life, you may be confused as to what the locals call some of the expressways.
For example, if someone says to turn left at Geno’s and head toward the Bell, then look for it behind Rocky, you might get lost.
The major highways and interstates cross-referenced with expressway names in the Philadelphia area:
- Schuylkill Expressway: I-76
- Delaware Expressway: I-95
- Pennsylvania Turnpike: I-276
- Mid-County Expressway / PA Turnpike Northeast Extension: I-476
- Vine Street Expressway: I-676
- Interstate 295
- Roosevelt Expressway: US 1
Road Conditions in Philadelphia, PA
According to TRIP, a national transportation research group, around 70% of roads in Philadelphia are either in mediocre or poor condition.
Philadelphia, PA Road Conditions
| Road Condition Type | Percent of All Roads |
|---|---|
| Poor | 28% |
| Mediocre | 35% |
| Fair | 14% |
| Good | 22% |
The road conditions in the city result in added wear and tear on your car. Potholes can cause accidents or a tire puncture, suspension damage, wheel rim damage, and other damage.
Folks in Philadelphia spend $732 every year to maintain their cars, which ranks them 143 in the nation. The San Francisco/Oakland area ranks first with yearly vehicle maintenance fees of $1,049.
The following video from CBS Philly goes into more detail about the poor Philadelphia road conditions.
Potholes increase your risk of getting into an accident.
Does Philadelphia, PA use speeding or red light cameras?
Running a red light is dangerous. It puts pedestrians and other drivers in harm’s way. Philadelphia currently uses both red light and speed cameras. However, speed cameras are now being tested and only applicable in work zones.
Read more: How to Avoid Being Involved in a Work Zone Crash
The city has installed red-light cameras in 31 locations in Philadelphia. In 2019, the city started a pilot program to implement speed cameras along the 12 miles of Roosevelt Boulevard.
The cameras are only expected to issue citations when workers are present in the work zone. The pilot program is part of a broad plan of achieving zero traffic deaths in the city by 2030. (For more information, read our “If You Do Not See Workers in a Work Zone, You Could Be in Serious Trouble“).
Drive carefully and keep a close eye on those lights. You don’t want to find out how much a Philadelphia red light camera ticket costs.
For more information, see what do red light cameras look like?
Vehicles in Philadelphia, PA
Your insurance rate is also dependent on vehicular factors such as what car you drive and if it is on the theft list. In this section, we will cover these topics and more.
For more information on vehicle theft, see does car insurance cover theft?
Most Popular Vehicles Owned in Philadelphia, PA
According to Your Mechanic, the most popular car in Philadelphia is the Nissan Maxima. The Maxima is the full-sized sedan offered by Nissan in the North American market.
The current generation Nissan Maxima is awarded a five-star safety rating by the National Highway Traffic Safety Administration.
The Maxima gets good gas mileage with a rating of 20 city and 30 highway miles per gallon. However, another category that Your Mechanic looks at is cities with vehicles which have V8 engines or higher.
These cars with higher-cylinder engines aren’t as fuel-efficient as smaller engines do, and Philadelphia ranks 61st on the list.
Cars per household in Philadelphia, PA
As many large cities do, Philadelphia has a large and well-developed transit system which is utilized daily by thousands of commuters. But this doesn’t mean that everyone takes the bus.
In fact, more than 40% of households in Philadelphia own one car. This is still below the national average of two cars per household.
Households without a Car in Philadelphia, PA
In 2015, around 31% of households owned no car in Philadelphia. The low ownership of cars is due to the excellent transportation network, road congestion, and lower annual income.
Speed Traps in Philadelphia, PA
You should always obey posted speed limits as it protects you and others around you. It can also prevent you from getting a ticket.
Law enforcement in Philadelphia has several speed traps around the city. Additionally, the city installed speed cameras around the city at the end of 2019.
Vehicle Theft in Philadelphia, PA
According to the FBI, 5,483 vehicle thefts occurred in Philadelphia in 2017. When considering your next car purchase, one thing to consider is that certain vehicles are stolen more frequently, and thus, may have higher insurance rates.
Philadelphia has one of the highest crime rates in the country, and you can see how it comes to the 15 states with the highest vehicle theft rates. The crime index is 90 out of 100, which means that 90% of other cities in the nation is safer than the city of brotherly love.
You have a one in 106 chance of becoming a victim of violent crime, while the statewide average is one in 319.
The chart below tells more about specific crimes in the city:
Philadelphia, PA Violent Crime Rates Compared to the National Average
| Violent Crimes | Philadelphia Rates (per 1,000) | United States Rates (per 1,000) |
|---|---|---|
| Murder | 0.20 | 0.05 |
| Rape | 0.75 | 0.42 |
| Robbery | 3.81 | 0.98 |
| Assault | 4.69 | 2.49 |
However, you also have safe neighborhoods in the city that reduce the risk of becoming a victim.
- Byberry Rd / Depue Ave
- Chestnut Hill / Chestnut Hill College
- Cherokee St / W Hartwell Ln
- Germantown Ave / W Willow Grove Ave
- Mount Airy
- Old Line Rd / Ridge Ave
- Ridge Ave / Flamingo St
- Roseglen
- Rhawn St / Rowland Ave
- Stevens Rd / Byberry Rd
Traffic in Philadelphia, PA
Waiting, stressing, aggravation. We’ve all been there. Traffic is the worst. Getting stuck in bumper to bumper traffic also puts you at a higher risk of getting into a car accident.
Let’s take a closer look at the traffic congestion in Philadelphia to see if it might be increasing your car insurance rates.
Traffic Congestion in Philadelphia, PA
Philadelphia is the ninth most congested city in the country and boasts three of the most congested expressways for trucks. But the city is fighting back.
As recent as 2019, city officials have begun ticketing drivers and buses that block bike lanes and cause traffic backups.
Transportation in Philadelphia, PA
According to DataUSA, the average commute time in Philadelphia is 31.7 minutes, which is higher than the national average of 25.5 minutes.
More than 26% of commuters spend more than 45 minutes in their daily commute.
As you see from the data, commuters in Philadelphia use public transit and carpooling to help fight traffic and congestion in the city.
Busiest Highways new Philadelphia, PA
The major highways or expressways in Philadelphia are the Schuylkill Expressway, or I-76. There is also the Delaware Expressway, which his part of I-95. Finally, there is also the Pennsylvania Turnpike, or I-276.
However, according to the Federal Highway Administration, Philadelphia does not have a 10-12 lane highway system to manage the traffic flow better.
Atlanta’s section of I-75 leads the way in this category with 15 combined lanes of northbound and southbound lanes.
How safe are Philadelphia, PA streets and roads?
The state of Pennsylvania had 1,137 traffic fatalities in 2017. Philadelphia, which is the largest city in the state, accounted for 94 of those deaths.
The chart below shows various accident types, and how many occurred.
Philadelphia, PA Rate of Traffic-Related Fatalities
| Crash Types | 2017 Fatalities | 2016 Fatalities | 2015 Fatalities | 2014 Fatalities | 2013 Fatalities |
|---|---|---|---|---|---|
| Total fatalities (all crashes) | 94 | 101 | 94 | 97 | 89 |
| Fatalities in crashes involving an alcohol (impaired driver) | 22 | 23 | 31 | 26 | 21 |
| Single vehicle crash fatalities | 55 | 57 | 66 | 65 | 57 |
| Fatalities in crashes involving a large truck | 4 | 2 | 2 | 3 | 6 |
| Fatalities in crashes involving speeding | 29 | 22 | 32 | 34 | 21 |
| Fatalities in crashes involving an intersection | 37 | 50 | 35 | 41 | 27 |
| Passenger car occupant fatalities | 24 | 29 | 28 | 31 | 24 |
| Pedestrian fatalities | 37 | 43 | 26 | 38 | 36 |
| Pedal/cyclist fatalities | 2 | 3 | 7 | 3 | 0 |
The largest county in Pennsylvania is also named Philadelphia, and it led the way with 94 traffic-related fatalities in 2017.
Pennsylvania, PA Traffic Fatalities by County
| Pennsylvania Counties by 2017 Ranking | 2017 Fatalities | 2016 Fatalities | 2015 Fatalities | 2014 Fatalities | 2013 Fatalities |
|---|---|---|---|---|---|
| 1. Philadelphia County | 94 | 101 | 94 | 97 | 89 |
| 2. Allegheny County | 67 | 72 | 54 | 59 | 65 |
| 3. Bucks County | 51 | 52 | 56 | 44 | 44 |
| 4. Berks County | 48 | 35 | 39 | 33 | 41 |
| 5. Montgomery County | 43 | 32 | 34 | 38 | 40 |
| 6. Lancaster County | 42 | 44 | 48 | 62 | 45 |
| 7. York County | 38 | 39 | 40 | 45 | 44 |
| 8. Dauphin County | 36 | 30 | 19 | 17 | 25 |
| 9. Westmoreland County | 36 | 33 | 41 | 35 | 30 |
| 10. Chester County | 35 | 24 | 35 | 34 | 33 |
| Top 10 counties | 490 | 470 | 483 | 489 | 474 |
| All other counties | 647 | 718 | 717 | 706 | 735 |
| Total for all counties | 1,137 | 1,188 | 1,200 | 1,195 | 1,209 |
According to the U.S. Department of Transportation, Philadelphia County also saw many railway accidents.
Unfortunately, your car insurance rates will be higher than average if you live in a city where traffic accidents occur more often.
Allstate America’s Best Drivers Report
Allstate created a list of the top cities where drivers are least likely to get into a car accident. Philadelphia didn’t do well, ranking 190th out of 200 cities.
Needless to say, more accidents equal more insurance claims, thus driving up premiums.
An average driver in Philly spends only 6.3 years between claims, whereas the national average is 10.6 years.
The problem is also reflected by the higher than average hard-braking events.
In Philadelphia, there were 43.9 hard-braking events per 1,000 miles driven. The national average is only 19 hard-braking events for every 1,000 miles driven.
Ridesharing in Philadelphia, PA
Maybe you’ve decided that owning a vehicle isn’t compatible with your lifestyle any longer, but you still need to get to work and other places. Check out this list of ridesharing companies in Philadelphia to keep you mobile:
- Blacklane
- Carmel
- Curb
- Jayride
- Limos.com
- Lyft
- Taxi
- Uber
Weather in Philadelphia, PA
It can get chilly in Philly. Temperatures during the winter months average in the 40s and residents can expect 23 inches of snow, on average.
During the summer months, temperatures range in the mid-80s, but higher temps have been recorded.
The number of disasters in Philadelphia County is 21, which is much higher than the national average of 13. The most common disasters listed are hurricanes, winter storms, floods, snowstorms, and tropical storms. For a few tips for driving in back weather, check out how to drive safely in bad weather and 25 facts about winter weather car crashes.
Public Transit in Philadelphia, PA
It’s easy to get around in Philadelphia when you use public transit. SEPTA operates a network of buses, subways, and commuter rails that is one of the most comprehensive systems in the country.
The transit authority offers a reloadable card called Septa Key along with many types of passes.
Alternate Transportation in Philadelphia, PA
PennDOT does not allow e-bikes and e-scooters on roads and sidewalks in Philadelphia. However, there are steps underway to amend the law to enable folks in the city to utilize this alternate mode of transportation.
Parking in Philadelphia, PA
No one wants to get the boot for parking in the wrong spot. It’s just a big hassle. And it can be expensive in some locations. Fortunately, Philadelphia has many ways to ensure you never end up getting a parking ticket.
You can use mobile applications to book parking ahead of time. The three most commonly used apps are SpotHero, Parkwhiz, and Parking Panda
There are thousands of metered parking spots that you can pay for using the meterUP App. You can find the locations on the website of the Philadelphia Parking Authority.
Air Quality in Philadelphia, PA
Many large cities have problems with pollution, and Philadelphia is no exception. The city’s Air Quality Index (AQI) was worse than the national average. Although the emergence of alternative and green vehicles has alleviated some of the problems.
The following chart measures AQI in the Philadelphia region.
Philadelphia, PA Air Quality
| Philadelphia-Camden-Wilmington | Total Number of Days |
|---|---|
| Number of days with AQI | 365 |
| Good days | 132 |
| Moderate Days | 214 |
| Unhealthy for sensitive groups | 16 |
| Unhealthy days | 3 |
| Very unhealthy days | 0 |
Traditional transportation contributes to air pollution by releasing particulate matter, volatile organic compounds, nitrogen oxide, and other such compounds.
Military and Veterans in Philadelphia, PA
Many insurance companies offer car insurance discounts for military members, their extended families, and veterans. To all military personnel, we salute you, and thank you for your service.
In this section, we will discuss the rates and discounts that the men and women in uniform can expect from insurance companies operating in Philadelphia.
In Philadelphia, the majority of military personnel and veterans have served in Vietnam and the Second Gulf War.
The closest military base to Philadelphia is McGuire-Dix-Lakehurst Base that jointly hosts the 87th Air Base Wing, 305th Air Mobility Wing, and the USAF Expeditionary Center.
If you are a veteran or in the military, the following providers offer military discounts:
- Allstate
- Esurance
- Geico
- Liberty Mutual
- Metlife
- StateFarm
- The General
- USAA
See the following table for average rates you can expect from insurance companies in the state of Pennsylvania:
Philadelphia, PA Average Annual Car Insurance Rates for Veterans
| Companies | Average Annual Car Insurance Rate |
|---|---|
| USAA | $1793.37 |
| Geico | $2605.22 |
| State Farm | $2744.23 |
| Nationwide | $2800.37 |
| Allstate | $3984.12 |
| Progressive | $4451.00 |
| Liberty Mutual | $6055.20 |
| Travelers | $7842.47 |
Beside, USAA car insurance, which requires all policyholders to be military-affiliated, Geico, State Farm, and Nationwide provide the cheapest options for military personnel.
Free Car Insurance Comparison
Enter your ZIP code below to view companies that have cheap car insurance rates.
Secured with SHA-256 Encryption
Unique Philadelphia, PA Laws
Maybe you’re a life-long resident or just recently located. There may be some laws that you are unaware of including this unique Philadelphia law: It’s illegal to ride in a boat on a trailer while being pulled on the highway. To keep your insurance costs down and avoid a ticket, it’s probably best to stay in the car.
Here are some other laws that may help you navigate around the city:
Food Trucks
We all love the cheesesteaks in Philly, so much, so that food trucks have become very popular in the city.
Setting up a food truck business in Philadelphia requires permits and licenses that can cost anywhere between $500-$1000.
As a food truck vendor, you need to know about health codes and get certified in food safety. You also need a commissary where you clean, prepare and store food. Plus, you’ll need to check up on what insurance is required for a food truck in Philadelphia.
However, one of the biggest challenges is to find parking for your food truck. You must be aware of the zoning laws to operate a food truck.
Parking Laws
You can find metered parking in the city, or if you live or do business in a specified neighborhood, you can request a parking permit from the Philadelphia Parking Authority.
In the following table, you can see the fines for common parking violations.
Philadelphia, PA Parking Violation Fines
| Parking Violations | Fines |
|---|---|
| Blocked driveway | $51 |
| Blocked mass transit vehicle | $101 |
| Bus zone | $51 |
| Blocking HP ramp | $76 |
| Handicapped space | $301 |
| On crosswalk | $51 |
| Sidewalk | $51 |
| Snow route | $51 |
| Taxi stand | $31 |
Avoid getting ticketed by planning ahead when parking in this city.
Handheld Device Laws
The use of handheld devices while driving in the city of Philadelphia is banned. You cannot use your handheld device to dial, talk, or text while driving in the city.
Tiny Homes
Tiny homes could be the modern solution to homelessness and lack of affordability for some lower-income residents.
The city of Philadelphia is welcoming the new concept in the hope that it will help residents find stable housing while addressing the city’s homelessness issue.
Frequently Asked Questions
What factors affect car insurance rates in Philadelphia, PA?
Several factors can impact car insurance rates in Philadelphia, PA, including:
- Driving record: Drivers with a history of accidents or traffic violations may pay higher premiums.
- Vehicle type: The make, model, and age of your car can affect insurance rates.
- Coverage and deductibles: The level of coverage you choose for liability, comprehensive, and collision insurance, as well as the deductibles you select, can impact your premiums.
- Age and gender: Younger drivers and male drivers often face higher insurance rates due to statistical risk factors.
- Credit history: In some cases, insurance companies may consider your credit history when determining rates.
- Location: Urban areas like Philadelphia may have higher insurance rates due to factors such as traffic congestion, crime rates, and accident frequency.
What types of car insurance coverage are available in Philadelphia, PA?
Car insurance coverage options available in Philadelphia, PA, typically include:
- Liability coverage: Covers injuries and property damage you cause to others in an accident.
- Collision coverage: Pays for repairs or replacement of your vehicle if it’s damaged in a collision.
- Comprehensive coverage: Protects against non-collision incidents like theft, vandalism, or natural disasters.
- Personal injury protection (PIP): Covers medical expenses and other related costs for you and your passengers after an accident, regardless of fault.
- Uninsured/underinsured motorist coverage: Provides coverage if you’re involved in an accident with a driver who doesn’t have insurance or doesn’t have enough coverage.
- Medical payments coverage: Helps cover medical expenses for you and your passengers, regardless of fault.
How can I find affordable car insurance in Philadelphia, PA?
To find affordable car insurance in Philadelphia, PA, consider the following tips:
- Shop around and compare quotes from multiple insurance providers.
- Ask about available discounts, such as safe driver discounts, multi-policy discounts, or discounts for certain safety features in your vehicle.
- Maintain a clean driving record and avoid accidents or traffic violations.
- Consider higher deductibles if you can afford to pay more out of pocket in the event of a claim.
- Look for usage-based insurance programs that offer discounts based on your driving behavior.
- Consider bundling your car insurance with other policies, such as homeowners or renters insurance, for potential discounts.
Are there any specific car insurance requirements in Philadelphia, PA?
In Philadelphia, PA, as in the rest of Pennsylvania, drivers are required to carry certain minimum car insurance coverage. The state’s minimum liability coverage limits are:
- $15,000 for bodily injury or death per person.
- $30,000 for bodily injury or death per accident.
- $5,000 for property damage per accident.
Can I get car insurance coverage for ridesharing services in Philadelphia, PA?
Yes, several insurance companies offer specific coverage options for ridesharing services like Uber and Lyft. These policies provide coverage during the different stages of ridesharing, including when you’re logged into the app but haven’t yet accepted a ride, while transporting passengers, and during periods when you’re not actively working. Contact insurance providers to inquire about ridesharing coverage options in Philadelphia.
Free Car Insurance Comparison
Enter your ZIP code below to view companies that have cheap car insurance rates.
Secured with SHA-256 Encryption
Dani Best
Licensed Insurance Producer
Dani Best has been a licensed insurance producer for nearly 10 years. Dani began her insurance career in a sales role with State Farm in 2014. During her time in sales, she graduated with her Bachelors in Psychology from Capella University and is currently earning her Masters in Marriage and Family Therapy. Since 2014, Dani has held and maintains licenses in Life, Disability, Property, and Casualt...
Licensed Insurance Producer
Editorial Guidelines: We are a free online resource for anyone interested in learning more about auto insurance. Our goal is to be an objective, third-party resource for everything auto insurance related. We update our site regularly, and all content is reviewed by auto insurance experts.


